
Miami Beach Real Estate: A Six-Year Retrospective of the Miami Beach Condo Market
I haven’t been around much lately; the reason for that will become apparent very soon. In the meantime, this post was inspired by an email from a consumer who wants to buy a Miami Beach condo and asked me for some insight. Since I didn’t readily know the answer to the question (and I usually do), I figured it was time to bury myself in some stats.
Fun with Graphs (Lots and Lots of Them)
After punching up all these graphs, I was a little surprised to see where we’ve been in relationship to where we are now. In this post, I’ll review the inventory of available Miami Beach condos, as well as the average price per square foot (PPSF) and the luxury condo market over $2M.
Six-Year Snapshot of Miami Beach Condo Inventory: All Ranges

The graph above shows that the market peaked in 4/05, when the number of condos for sale was the lowest (911) and the number of condos sold was the highest (249). At that time, there were only 3.7 months of condo inventory available, which represents a strong sellers’ market. A real estate market is considered balanced when six to nine months of inventory is available.
Inventory peaked in 7/07, with almost 4,000 units on the market. The sales low-point was between late 2007 and early 2008, with only 70 units sold in 1/08. Currently, there are 2,751 condos for sale in Miami Beach.
Miami Beach Condos: Months of Inventory

Months of Inventory is used to indicate or assess how long it would take to sell all existing condos on the market, assuming the rate of sales stays constant and no new listings are added. Again, the market is considered balanced when six to nine months of inventory is available. In 1/08, there were 56 months of Miami Beach condo inventory available based on closed sales. Today, we are clearly still in a buyers’ market with 17.1 months of inventory available.
Miami Beach Condos: Tracking Average Price per Square Foot

This graph is kind of boring. Not much can be gleaned from it in my opinion, but some people love it. I don’t like it because it represents an average. Miami Beach condo inventory swings from one end of the spectrum to the other.
Say you are interested in buying a condo at Apogee South Beach and want to use this chart as a guide. Waste of time. It includes all condos, all price ranges and distressed sales (short sales and bank-owned real estate).
One interesting nugget of info seems to be that the average PPSF peaked in 4/08 at $679. Weird. Today, the average PPSF is $463, which puts us just about at the 4/05 price level ($464).
Average Price per Square Foot for a Miami Beach Condo: Excluding Distressed Sales (bank-owned and short sales)

I know these numbers are spot-on because the average PPSF in 4/05 and 4/08 is the same in this chart as it is in the previous chart ($464 and $679 respectively). The effect of distressed sales begins to reveal itself in 1/09 through today. The current average PPSF (w/o non-distressed sales) is $659. That is almost a $200 PPSF difference. Moving right along to my favorite niche…
Luxury Miami Beach Condos: Six-Year Retrospective – $2M+

This chart is pretty self-explanatory. Inventory peaked in 1/09 with 228 Miami Beach condos for sale OVER $2,000,000. Currently, there are 162 units on the market at this price point. One note about this graph: Apogee and Continuum North were not built until 2008.
Average Price per Square Foot: Miami Beach Luxury Condos

Interesting to note here that the average PPSF for luxury Miami Beach condos peaked right around the same time as the under $2M condos. The numbers here are up and down, but the average PPSF is currently at $1,138 in the luxury sector. The numbers are elevated because a few high-priced condos at Setai, One Bal Harbour and Fontainebleau II closed in the last month or so.
Miami Beach Luxury Condos: Months of Inventory

Eeeh. Some sharp peaks, but overall it looks as though things are headed in the right direction for the $2M+ condo market. Currently, there are 24 months of inventory at the high end, and clearly that’s not good, but all the really good, prime units in A+ buildings are sold. I think the luxury condo market bottomed out last summer. Deals, really good ones, on really good apartments, have been had. Those days, my friends, are gone.
Before I wrap this all up, I found one more chart that is really eye-opening to me. Probably the best one of them all:
Miami Beach Distressed Condo Sales Statistics: Under $500k
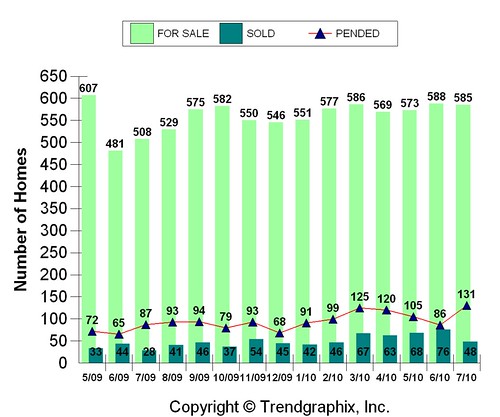
- 2,751 condos on the market in Miami Beach
- 640 or 23.3% are distressed sales
- 585 of the 640 are under $500k (see chart above)
Well, Kevin, What’s Going to Happen Here?
Since my crystal ball, along with everyone else’s Mercedes, is in the shop…
I think that for Miami Beach, clearly, the worst is over. The market has bifurcated. It’s either you are over or under $500k. Period. But, now more than ever, real estate fundamentals, along with your objectives, should be the things that guide you most as you meander through the real estate landscape. Obviously, the best units in the best buildings in the best locations are no-brainers. If you are looking in the under $500k range, there are still going to be some good buys for the foreseeable future. As you can see in the chart above, the inventory of distressed properties is still coming to market at a fairly steady rate, and I don’t see any signs of that inventory drying up anytime soon.
Related Reading
_


